Modern Lithium-Ion Batteries(LIB) contain organic solvents(carbonates, ethers, etc) and salt anions(PF6-, BF4-, ClO4-, etc) which are not electrochemically stable and will undergo decomposition reaction to form a passivating layer, referred to as the Solid Electrolyte Interface(SEI). It is at this interface where the crucial electrochemical reaction, which governs the whole battery performance, occurs. Thus Dr. Hwang et al conducted a molecular level analysis observing thermodynamics, transport phenomena, and electrochemical reactions in an effort to better understand battery technology.
Method

Molecular Dynamic simulations with the OPLS-AA force field using the GROMACS simulation package were performed. The rectangular simulation cell contains liquid electrolyte (1M LiPF6 in EC: DMC 1:1 molar ratio).
Results and Analysis
1) Electrolyte distribution

The figure above reflects the data drawn from the simulation. the x-axis refers to the nm distance from the electrode with going right means further away from the electrode. y-axis refers to the degree of concentration, a higher y value indicates more of the variable. For the uncharged electrode(neutral state), it was observed that EC(cyclic ethylene carbonate) and DMC(linear dimethyl carbonate) are packed more densely at the interface by approximately 2,3 times higher than their bulk values respectively. This can be explained by the van der Waals force overcoming the bulk density. Another point that was observed was the Lithium-ion peak which is indicated with the blue area. Circle in the middle, where relative Lithium-ion concentration is high shows accordance with the minimum EC and DMC density. This is because the more lithium-ion is present, it is difficult for the densely packed carbonate complexes to rearrange and solvate lithium ions.

In the case of the charged electrode (b), the electric field causes rearrangement of EC and DMC. As a result, EC was observed to have a concentration that is 4 times the uncharged electrode due to smaller van der Waals volume. EC and DMC together are packed near the charged electrode and creates a shielding effect which functions as a separator, blocking lithium-ion from penetrating the electrode. Also, since the electrode is charged, lithium-ion concentration near the electrode is observed to be 10 times the uncharged electrode. The difference between figure (b) and (c) is the magnitude of charge(b = -11.6µC cm^-2; c = -16.4µC cm^-2). The result of c), tells that the shielding effect created by EC and DMC is too weak to compete with the attractive force between lithium-ion and charged electrode, and thus the noticeable amount of lithium-ion is leaked as a result.

Fig.4 a) can be connected with Fig3. b) and Fig.4 b) with Fig.3 c). In a), EC and DMC are oriented in such a way that effectively blocks the lithium-ion from touching the electrode which will result in decomposition reaction and damage the performance of the battery. In the case of the latter illustration, the attraction force was stronger than the shielding effect created by EC and DMC's orientation and thus lithium-ion is touching the charged electrode which is critical to battery health.
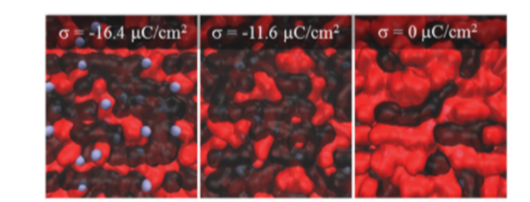
Figure 5 is basically 3d image of Fig.4. From uncharged to moderately charged, reorientation of EC and DMC is observed. From moderately charged to highly charged, lithium-ion penetration is observed.

Two things to note from the graph above. First, is the cross point of EC and DMC which is approximately at -6.8µC cm^-2. That specific point is where EC's smaller van der Waals volume allows for more packing near electrode compared to DMC(as the magnitude of the charge is increased). Second, the beginning point of lithium-ion penetration is approximately at -12µC cm^-2. At this charge, EC and DMC's shielding effect is outpowered by the attraction force between the lithium-ion and the charged electrode.
2) Effect of interfacial structure of Li+ ion transport

It is worth looking at Figure 7 with Figure 2 because they are related. The relative maximum and the relative minimum indicated with the blue lines correlate with the relative maximum/minimum of lithium-ion concentration in figure 2. This is due to the energy penalty associated with the rearrangement of solvent molecules and partial dissociation of lithium-ion. For the coordination number in red, since it remains nearly unchanged for the region z=2.5nm to 1nm, it can be inferred that lithium-ion remain fully solvated while diffusing through the electrolyte and also suggest that part of the primary solvation sheath would move along with the lithium-ion rather than lithium-ion just moving via ratchet mechanism(if lithium-ion is transported via ratchet mechanism it would show oscillations in the coordination number).

Again for the charged cases, the relative maximum/minimum of free energy correlates with the relative maximum/minimum of lithium-ion concentration and minimum/maximum concentration of EC and DMC. Another takeaway from this figure is that the fluctuation of free energy in charged electrodes corresponds to the change in spatial distribution shown in figure 5.
Conclusion
With the observed behaviors of the electrode-electrolyte surface, this study suggests further investigations. The extended research effort will allow the engineering of more developed lithium-ion batteries that will alter impact lives of billions.
Reference
Boyer, Mathew J, L. Vilčiauskas and G. Hwang. “Structure and Li+ ion transport in a mixed carbonate/LiPF6 electrolyte near graphite electrode surfaces: a molecular dynamics study.” Physical chemistry chemical physics : PCCP 18 40 (2016): 27868-27876 .
'Articles in English' 카테고리의 다른 글
| The buildup of the nanometer-thick SEI layer (0) | 2021.07.10 |
|---|---|
| Quantum Tunneling Phenomenon in Batteries (0) | 2021.06.20 |
| Trump's failed economy led to defeat in the election (0) | 2020.12.02 |
| How Donald Trump got elected as the President of U.S.A (1) | 2019.01.27 |


